Python Ecosystem Statistics: Extra Plots

Extra plots that didn't make the cut for the main page.

Extra Plots

CI and non-CI shares of PyPI wheel and source-distribution downloads since 2024
Figure 1: Share of wheel and source-distribution downloads attributed to CI and non-CI use by Linehaul. CI is undercounted because detection depends on clients reporting the CI field; Poetry does not, and some Docker builds may not be detected. Linehaul has recorded this field only since 2024.
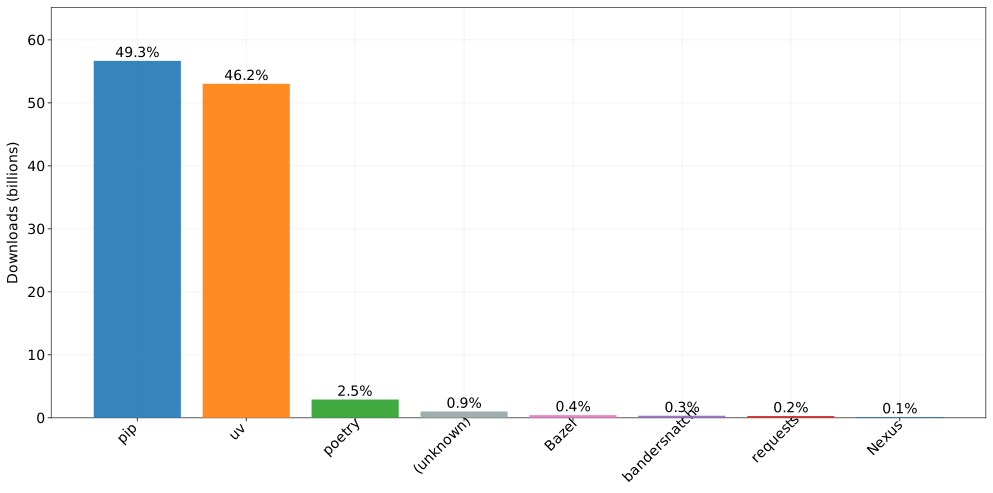
Thirty-day PyPI wheel and source-distribution downloads by installer tool
Figure 2: PyPI wheel and source-distribution downloads over the latest 30-day window by installer tool (Linehaul data). Only tools with more than 0.1% of downloads are shown.
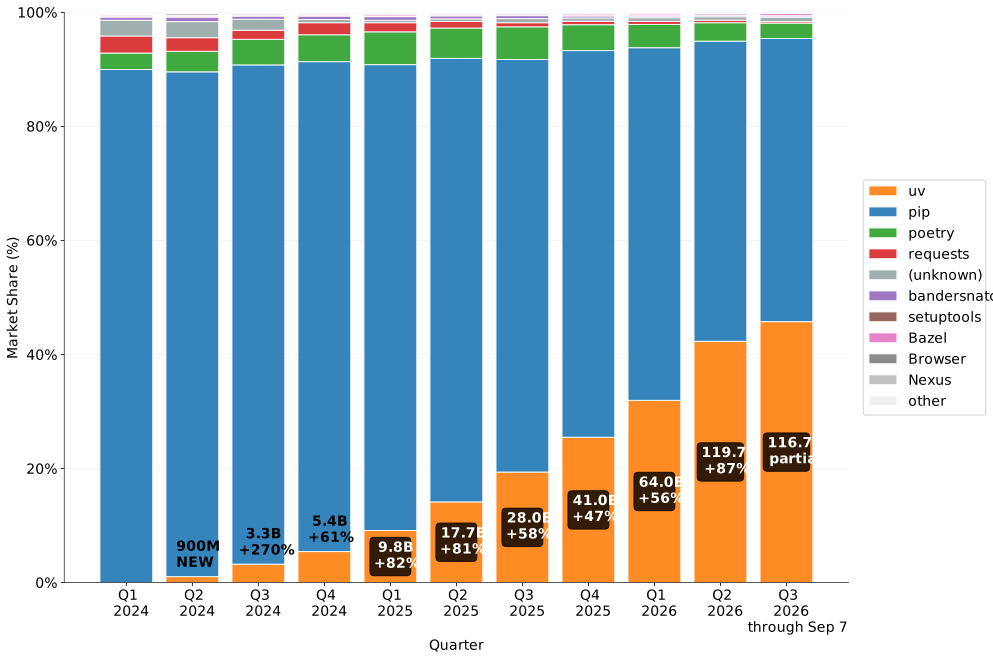
Quarterly PyPI wheel and source-distribution download share by installer tool
Figure 3: Quarterly share of PyPI wheel and source-distribution downloads by installer tool (Linehaul data). Tools averaging no more than 0.1% across the full dataset are grouped as other. An incomplete final quarter is marked as partial and is not compared with a complete quarter.
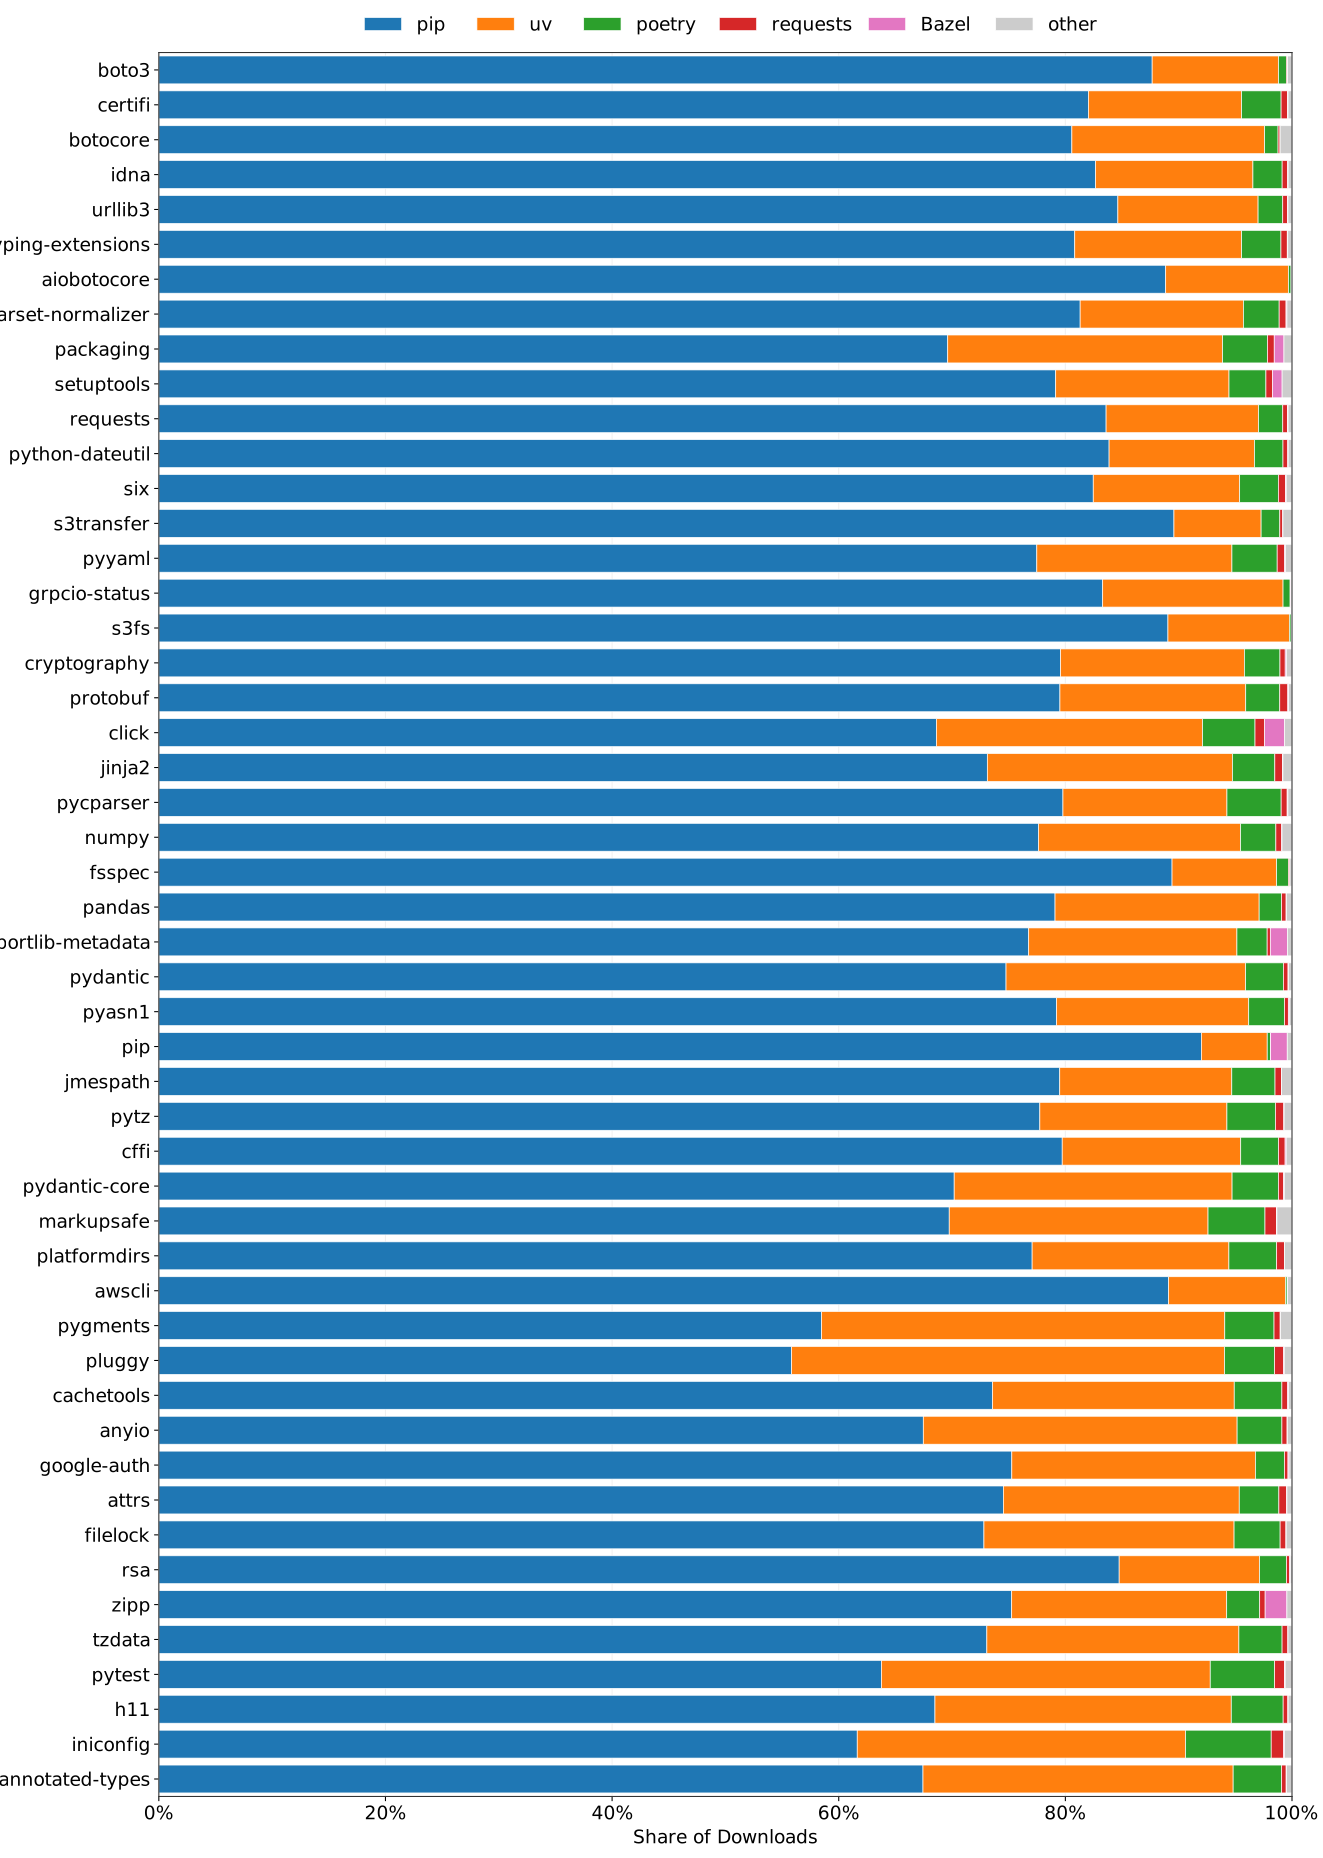
Installer-tool download share for each of the 50 most-downloaded PyPI packages in the January 2025 snapshot
Figure 4: Installer-tool download share for each of the 50 most-downloaded PyPI packages in the 2025-01-01 through 2025-01-24 snapshot (Linehaul data). Tools accounting for no more than 0.1% of total downloads are grouped as other.
Ninety-day rolling mean of daily uv download share by reported Python version
Figure 5: uv's share of wheel and source-distribution downloads for Python 3.8 through 3.14, as tracked by Linehaul. Each line is the 90-day rolling mean of daily uv share among downloads reporting that Python version. Lines start only after 90 observed days and no earlier than the version's stable release.
Bar chart classifying the 15,000 most-downloaded PyPI projects from root lockfiles only
Figure 6: Project managers identified only from lockfiles in the repository root. Blue bars include all 15,000 projects; orange bars include projects whose latest release reached PyPI in the preceding 365 days. Labels give exact counts.

This strict view recognizes uv.lock, Pipfile.lock, poetry.lock, pdm.lock, pixi.lock, and the paired Rye lockfiles. It excludes configuration files, generic requirements files, build backends, and CI commands. Repositories with lockfiles from multiple managers are reported separately.

Bar chart classifying the 15,000 most-downloaded PyPI projects with a chain of lockfile, configuration, and CI evidence
Figure 7: Project managers identified by a chain of repository, source-distribution, and automation evidence. The two bar series use the same populations as Figure 6; labels give exact counts.

The chain starts with repository-root lockfiles and manager-owned configuration. It then adds explicit manager tables from the latest PyPI sdist, but only when the analyzed sdist is the latest release. Build backends never classify a project; they only select unresolved projects for bounded automation inspection.

CI evidence must invoke the tool as an executable with a recognized project operation, such as poetry install, pdm sync, hatch run, or flit build. The parser understands shell wrappers, python -m, uv run, uvx, pipx run, subprocess calls, YAML blocks, and local composite actions. Comments, labels, environment values, version checks, tool installation, and backend strings do not count.

An unresolved project with root requirements files can be labeled pip + requirements when automation runs pip install -r … or installs the current project with pip install -e .. A single match is medium confidence; requirements consumed in multiple automation files are high confidence. Plain pip install ., bootstrapping pip or another tool, remote editable installs, and uv pip do not count.

Download the raw 15,000-project CSV. It records both classifications, repository commit, latest PyPI release, confidence, exact evidence, and unresolved conflicts.

Data